GridScope
Danish Electricity Carbon Intensity Analytics
About
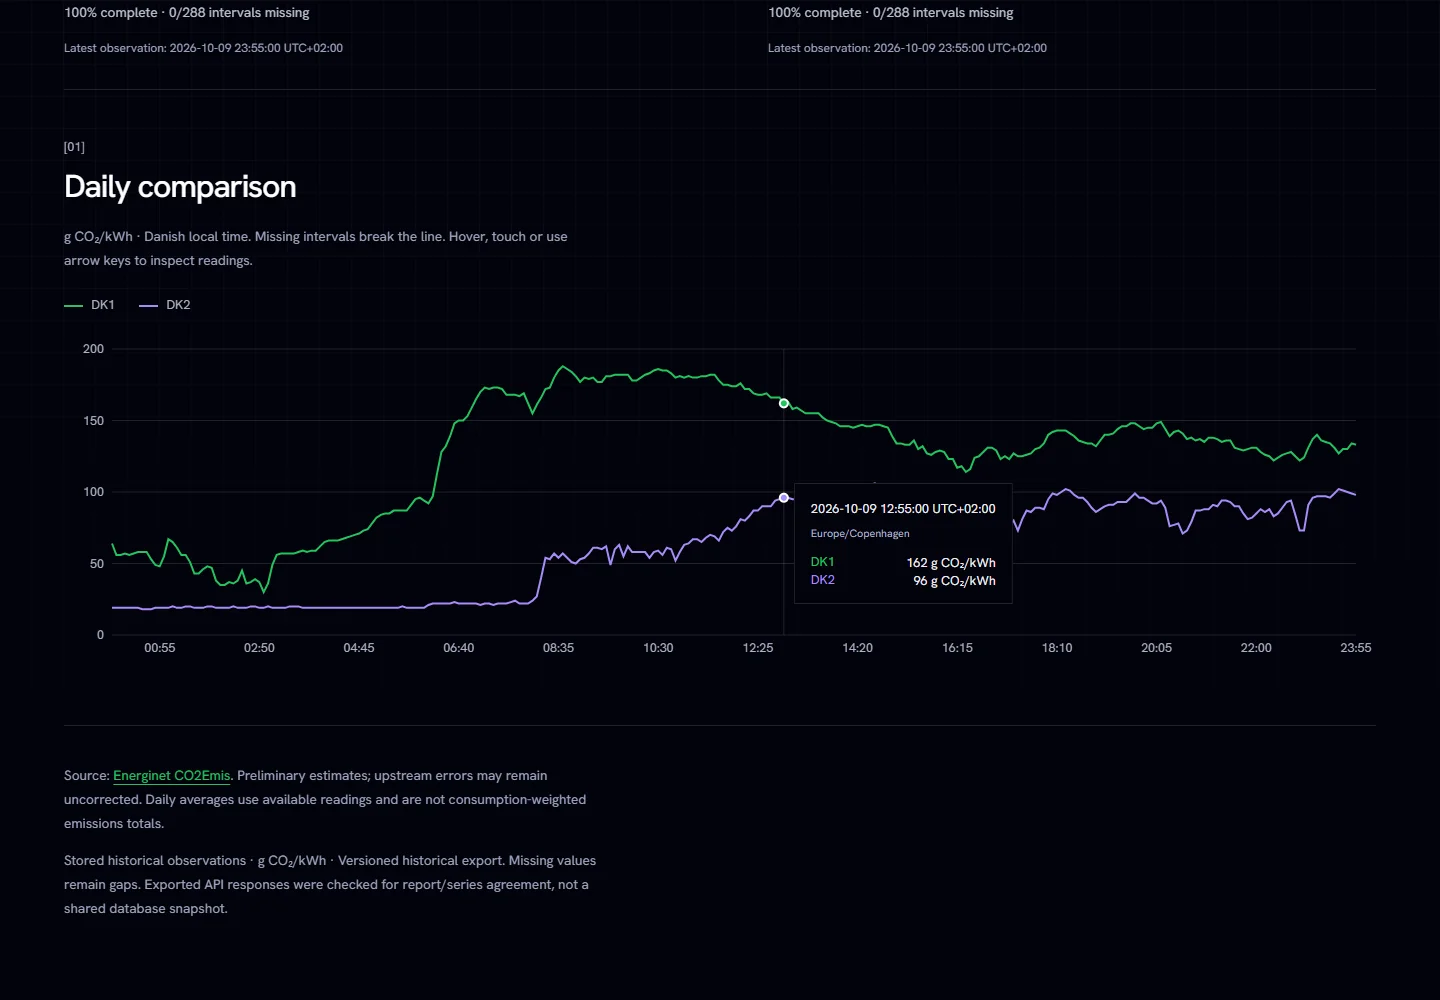
GridScope ingests, validates and stores five-minute carbon-intensity observations for Denmark’s DK1 and DK2 electricity regions. The React dashboard compares regions and exposes readings through hover and touch tooltips. Values in g CO₂/kWh represent carbon intensity, not total emissions.
Full application architecture
The Python 3.11 pipeline queries Energinet’s public API and validates observations before storing them in PostgreSQL. SQL reports calculate summaries and check missing intervals. FastAPI serves data to the frontend; Dagster orchestrates ingestion. This complete architecture is available in the repository and is separate from the public static demo.
Data quality
Transactional ingestion uses PostgreSQL advisory locks to coordinate concurrent runs. Observations are UTC-aligned, while reporting handles Europe/Copenhagen daylight saving time. Completeness checks account for missing intervals, and automated tests cover integration and frontend behavior.
Stack and delivery
Python 3.11 · PostgreSQL · FastAPI · Dagster · React 19 · TypeScript · Vite · Tailwind CSS 4 · Recharts · Docker · GitHub Actions · Cloudflare Pages.